

The Bruce Overnight Edge: Banner vs. Hulk III – The Size Effect
August 07, 2026 - Chicago, IL
Last week, in BOE-40 Banner vs. Hulk II – Why Retail “Improves” the Quote in the Overnight we dove into the numbers related to retail orders on Bruce ATS. Specifically, we highlighted statistical differences between orders that IMPROVE versus JOIN our market at the time of order entry1 . This week we’re going deeper into the bucket of IMPROVE orders. We looked at the 987k retail IMPROVE orders and divided them into 10 decile buckets of almost 100k orders each based on the notional size of the order. The goal was to tease out the effect that order size, in notional terms, had on the hit and fill rates for these orders2 . If you didn’t catch BOE-40 last week, it is probably worth reading up there first as we introduced this study3 there.
Table 1: July 2026 Bruce ATS IMPROVE Retail Order Decile Characteristics
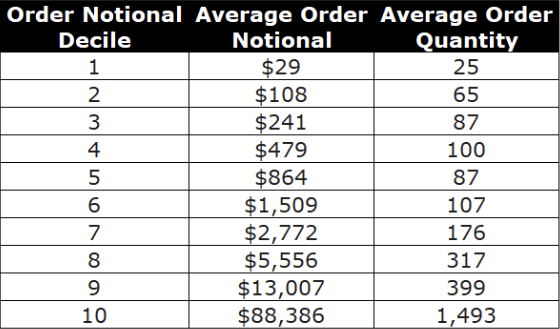
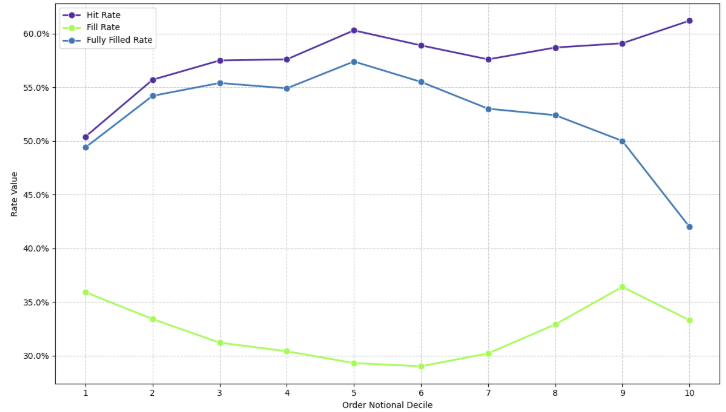
Chart 1: July 2026 Bruce ATS IMPROVE Retail Execution Rates by Order Notional Decile
IMPROVE Retail Order Observations:
- Bruce ATS accepted 987k IMPROVE retail orders for $11.1B in ordered notional
- The average order was for 286 shares and $11.3k
- The overall Hit Rate was 57.7%
- The lowest Hit Rate was in decile bucket 1 with 50.4%
- The highest Hit Rate was in decile bucket 10 with 61.2%
- The Fill Rate was 33.1%
- The lowest Fill Rate was in decile bucket 6 with 29.0%
- The highest Fill Rate was in decile bucket 9 with 36.4%
- The Fully Filled Order Rate was 52.4%
- The lowest Fully Filled Order Rate was in decile bucket 10 with 42.0%
- The highest Fully Filled Order Rate was in decile bucket 5 with 57.4%
The Fully Filled Order Rate Inflection Point
One interesting point to think about pertains to the Fully Filled Order Rate. This rate rises steadily from the smallest trades in decile 1 until it peaks in decile 5. The average order in this decile bucket is for 87 shares and $864 notional. The rate then declines steadily from decile 6 to 10. The average order in decile 10 is for 1,493 shares and $88,386. It seems straightforward that the large retail orders in decile 10 would have the lowest Fully Filled Order Rate. What is more interesting is the steady climb from the tiny $29 orders of decile 1 to the $864 orders of decile 5.
Large Order Hit Rate
These orders are highly visible (by definition they update the Bruce BBO) and are attractive precisely because they are large. An interested counterparty waiting for the right opportunity in a symbol knows they can likely execute their full size at a recently improved price in a single transaction. The fact that the Fully Filled Order Rate for decile 10 is the lowest indicates that the removing liquidity side of this trade is usually smaller than the adding order which makes sense because these are the largest accepted retail orders.
Fill Rate Smile
Of all the rates we looked at, Fill Rate was the most stable and had the smallest range (7.4% from highest to lowest) across the deciles. As average notional order size grew from $29 to $1,509 the fill rate fell from 35.9% to 29.0%. But as the average order size increased from $1,509 to $13,007 the fill rate climbed back up to a high of 36.4% before falling to 33.3% on the largest orders in decile 10.
By The Numbers
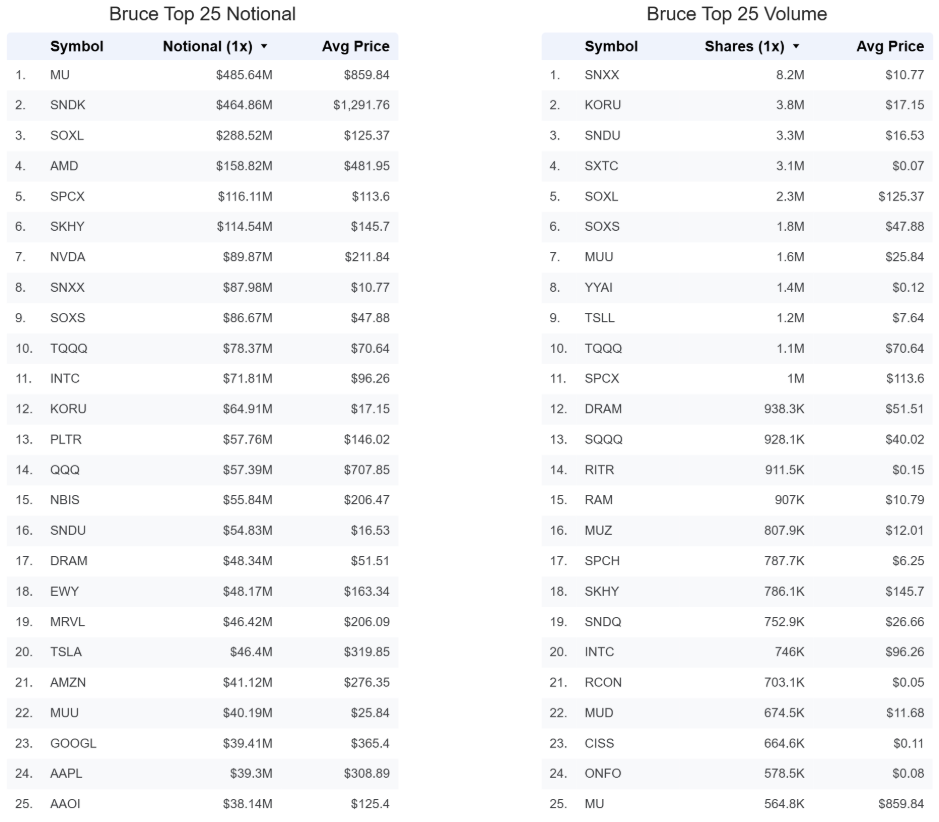
Weekly Top 25 Symbols4
Bruce on Tour
Our CEO, Jason Wallach, is a confirmed speaker at the 93rd Annual STA Market Structure Conference. On October 14th, he’s on the The Always-On Market: Liquidity, Volatility, and the Future of 24/7 Trading panel. He looks forward to connecting with other conference attendees.
The Bruce Markets Team
1See BOE-40 for the full Price Disposition model. For this BOE, IMPROVE orders are Buys with an order price that is > Best Bid and < Best Offer or Sells where the order price is < Best Offer and > Best Bid.
2Hit Rate = count(orders with > 0 executed shares) / count(orders)
Fill Rate = sum(executed shares) / sum(ordered shares)
Fully Filled Order Rate = count(orders where fill quantity = order quantity) / count(orders) and focused exclusively on Retail orders.
3All data for this study is from internal Bruce ATS sources covering trade dates 07/01/2026 through 07/31/2026. The study included all orders including cancel/replace or modified orders. All comparisons for price disposition are in relation to the Bruce ATS Best Bid and Best Offer (BBO) at the time of order entry. The study utilized an internal Bruce ATS classification to separate all activities into one of three segments (Retail, Proprietary/Market Maker, and Agency Broker) and focused exclusively on Retail orders.
4Top 25 data is from internal Bruce ATS sources through trade date 08/07/2026.