

The Bruce Overnight Edge: Banner vs. Hulk II: Why Retail “Improves” the Quote in the Overnight
July 31, 2026 - Chicago, IL
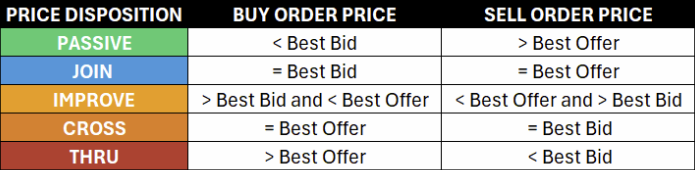
In BOE-31 Banner vs. Hulk: The Two Faces of Overnight Retail we discussed the price location of retail orders in relation to the Bruce ATS Best Bid and Best Offer (BBO) at the time of order entry. We categorized the orders according to the price disposition scale below (Table 1) to bucket for order aggressiveness. We then tied the categorized orders to shares executed. The conclusion was that if you look at order counts, retail orders are heavily tilted to the passive side (Bruce Banner) of the scale but if you look at where retail executions occur a small number of aggressive (Incredible Hulk) orders are responsible for most of the action.
Table 1: Price Disposition based on Order Side and Price Relative to the Bruce Best Bid and Offer
In BOE-31, we did not discuss retail order hit rates, fill rates, or fully filled order rates1. These key metrics represent a probabilistic look at an order’s chance to execute and for how many shares based on order and market characteristics. Today, we will focus our attention on these metrics. All numbers in this BOE Episode are from a study2 covering all retail orders on Bruce ATS for the month of July.
Chart 1: July 2026 Bruce ATS Retail Execution Rates
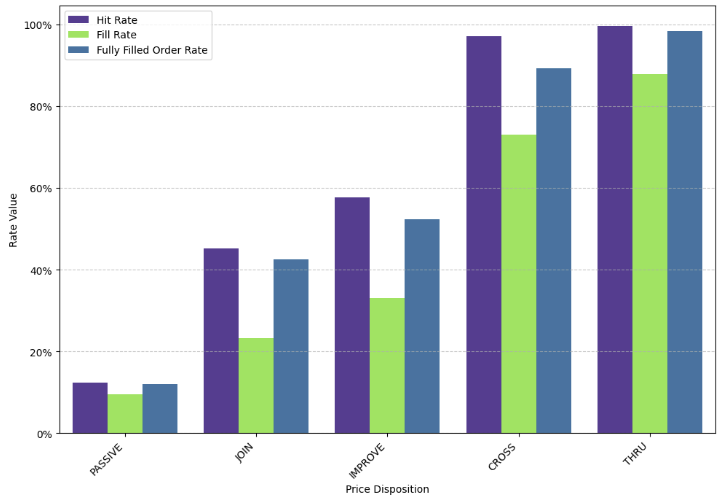
Table 2: July 2026 Bruce ATS Retail Order Data

Study observations:
- The study covered 4.6M retail orders for $37B worth of stock.
- The average order in the study was for 173 shares and $8,228.
- The overall Hit Rate was 25.1%
- The overall Fill Rate was 21.3%
- Hit Rate, Fill Rate, and Fully Filled Order Rate all scale as expected, getting steadily higher as the order price gets more aggressive.
- In all buckets, the Fully Filled Order Rate is materially closer to the Hit Rate than it is the Fill Rate. This relationship holds because retail orders tend to be smaller in size, so if they are hit they are more likely to be hit for the full size.
JOIN versus IMPROVE
We think the most interesting part of the study is the comparison between orders in the JOIN and IMPROVE buckets. Retail participants were 3.8x more likely to submit an order that improves the market than joins the market. Ordered notional in the IMPROVE bucket was 5.1x larger ($11.2B vs $2.2B) than the JOIN bucket, while the executed notional was 7.3x larger ($4.9B vs $676.2M). When compared to JOIN orders, IMPROVE orders garnered:
- +12.6% hit rate
- +9.9% fill rate
- +6.9% fully filled order rate
Much like The Incredible Hulk, in our opinion, Retail investors are often willing to be aggressive when the opportunity presents and IMPROVE the market. The much higher quantity of orders and ordered notional in the IMPROVE bucket versus the JOIN bucket illustrates that when Retail wants an execution, they are unafraid to establish a new price point and secure their place at the front of the line instead of waiting behind other orders at an existing price point. Our study shows that this strategy yields impressive gains in terms of both Hit and Fill rates.
By The Numbers
July is in the books for the overnight market and we’re excited to announce that Bruce ATS volume market share3 grew 22% month-over-month to 13.3%!
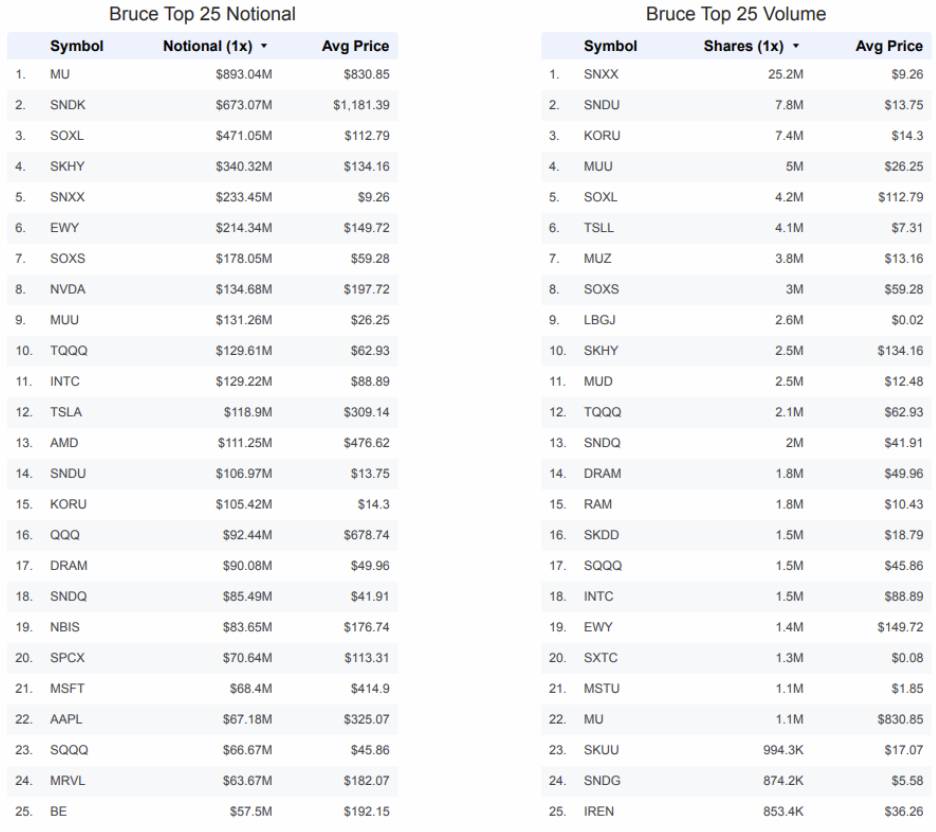
Weekly Top 25 Symbols4
The Bruce Markets Team
1 Hit Rate = count(orders with > 0 executed shares) / count(orders)
Fill Rate = sum(executed shares) / sum(ordered shares) Fully Filled Order Rate = count(orders where fill quantity = order quantity) / count(orders)
2 All data for this study is from internal Bruce ATS sources covering trade dates 07/01/2026 through 07/31/2026. The study included all orders including cancel/replace or modified orders. All comparisons for price disposition are in relation to the Bruce ATS Best Bid and Best Offer (BBO) at the time of order entry. The study utilized an internal Bruce ATS classification to separate all activities into one of three segments (Retail, Proprietary/Market Maker, and Agency Broker) and focused exclusively on Retail orders.
3 Market share based on internal and publicly available sources and includes Boats, Moon, and Bruce ATSs.
4 Top 25 data is from internal Bruce ATS sources through trade date 07/31/2026.