

The Bruce Overnight Edge: A Tale of Two Markets
March 20, 2026 - Chicago, IL
A Tale of Two Markets
A year ago, the overnight equities session averaged approximately 26M shares and $1.4B in notional. There has been tremendous growth and the current 30 day moving average for the overnight session is approximately 133M shares and $3.9B. In one year’s time, overnight shares traded are up 412% and notional is up 179%.
In the By The Numbers section of the BOE, we regularly list our Weekly Top 10 Symbols By Notional ($) and By Volume (Shares). Why do we share two lists? One reason is that the overnight session operates a bit like a split-brain ecosystem with two independent halves operating in parallel. To understand how the overnight session truly functions, we have to look past the top line numbers. The reality is that the overnight session operates as a “Tale of Two Markets”.
The Dollar Divide
According to ATS-N documents filed with the SEC, all three overnight ATS venues (Boats ATS, Moon ATS, and Bruce ATS) bifurcate their pricing model at the one dollar mark. Below $1.00, trades are charged on a % of notional traded basis. Above $1.00, the pricing model changes based on shares traded. This split is relatively standard on equity trading venues.
This week, we looked at data from a variety of sources1 to estimate how overnight volumes have split across this divide in 2026. Is the overnight market “all just low dollar stocks” as we sometimes hear? Let’s look at the data.
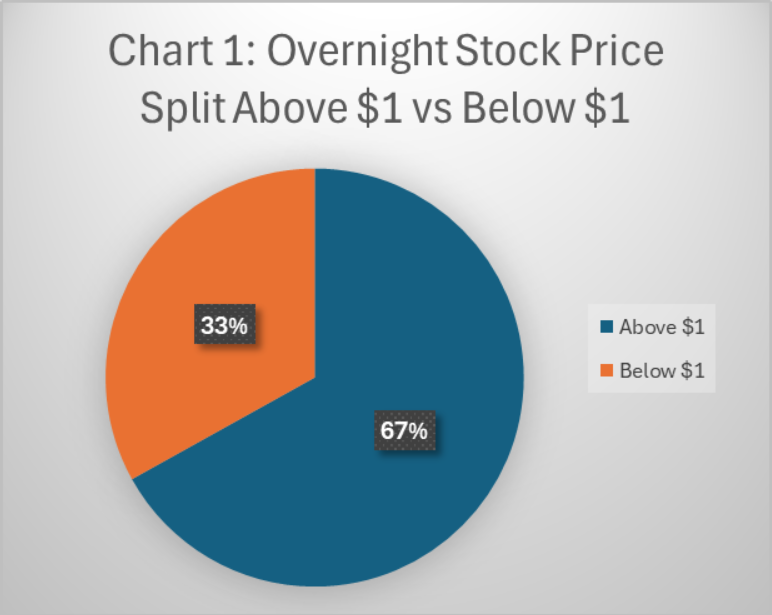
Our best estimate for 2026 is that of the 133M shares traded on average in the overnight session, ~44M of those shares are for stocks priced below $1. As you can see in Chart 1, this represents a robust 2 to 1 mix favoring stocks priced above $1.
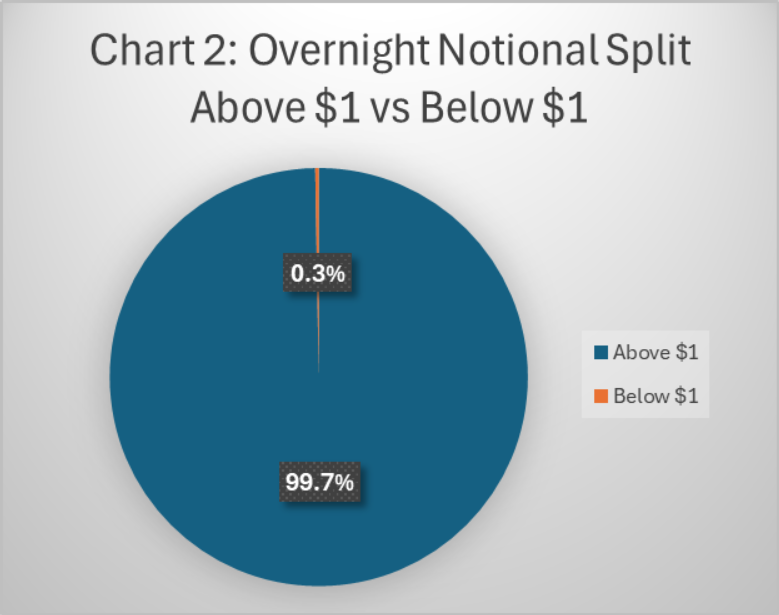
The analysis gets more interesting when you look at the notional on both sides of the divide (See Chart 2). Despite representing 33% of the share volume, our estimate is that stocks trading below $1 contribute only $10.6M or 0.3% of the total notional traded.
Our estimates are that in the vast majority of overnight sessions (47/54 sessions YTD), shares traded above $1 outpace the below $1 stocks. But when a below $1 stock heats up, it can dominate shares traded in the overnight session. In January, the symbols OCG and MTEN had a few monster volume days and pushed below $1 stock volume higher. Earlier this month, we saw symbol BHAT’s volume explode. This week, the symbol LBGJ joined the party.
We at Bruce Markets believe it is important to understand the nuance of this divide as it can affect risk mechanisms, operational processes, pricing, retail sentiment, and more. The overnight market is a Tale of Two Markets, both robust in their own way.
By The Numbers
Weekly Top Ten Symbols2
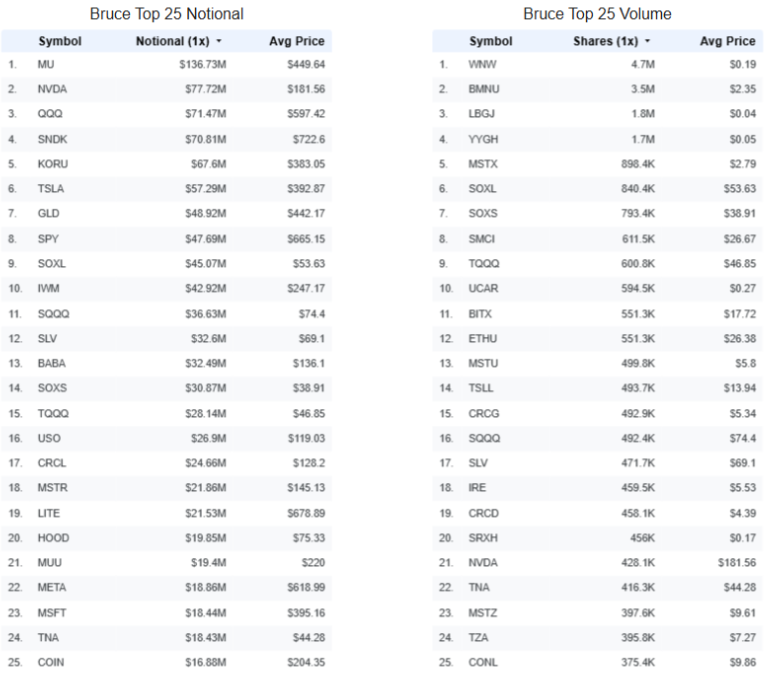
This week, since it is on topic, we’re expanding the Top 10 to be a Top 25 and we are including the average executed price on Bruce ATS for each list.
Bruce On Tour
- Attending the STANY 2026 Annual Conference? Be sure to check out our CEO, Jason Wallach, on the 24 Hour Trading panel. If you would like to meet up, the Bruce team will be in NY for the event and you can reach us at operations@brucemarkets.com.
The Bruce Markets Team
1Data sources include internal and public sources, Finra Published Data, and client conversations.
2Top 25 data is from internal Bruce ATS sources through trade date 03/20/2026.